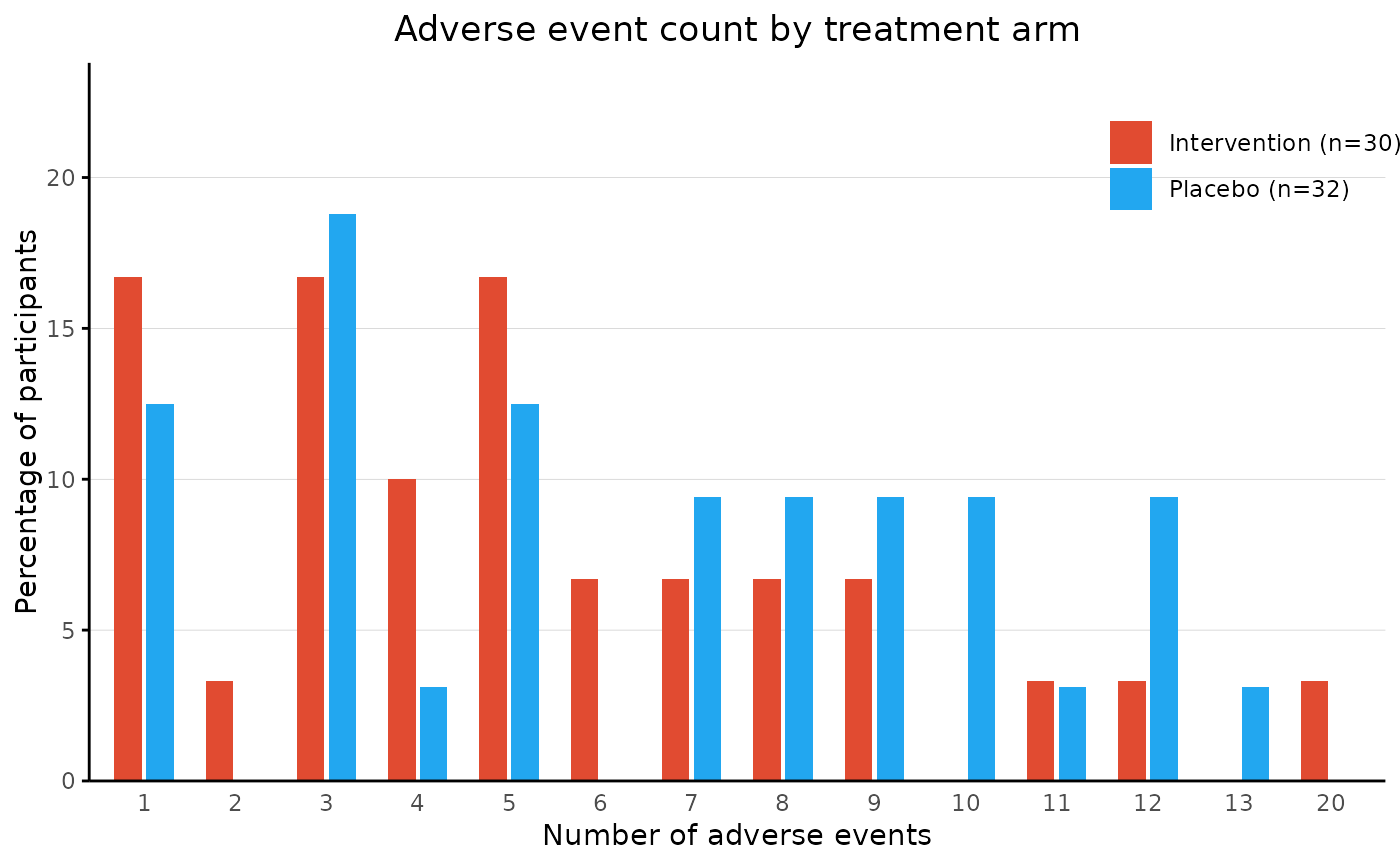
Bar chart for number of events reported per participant
aebar.RdBar chart for number of events reported per participant
Usage
aebar(
  data,
  arm_levels,
  id = "id",
  arm = "arm",
  adverse_event = "adverse_event",
  arm_names = NULL,
  arm_colours = NULL,
  facets = TRUE,
  save_image_path = NULL
)
Arguments
- data
data frame with adverse_event, id and arm columns
- arm_levels
vector of factor levels in arm variable
- id
name of id column
- arm
name of arm column
- adverse_event
name of adverse_event column
- arm_names
vector of names for each arm in arm variable
- arm_colours
vector of colours for each arm
- facets
a logical value whether to plot bar chart with facets
- save_image_path
file path to save bar chart as image
Examples
aebar(df2, arm_levels=c("Intervention","Placebo"), adverse_event="ae_pt", facets=FALSE)
