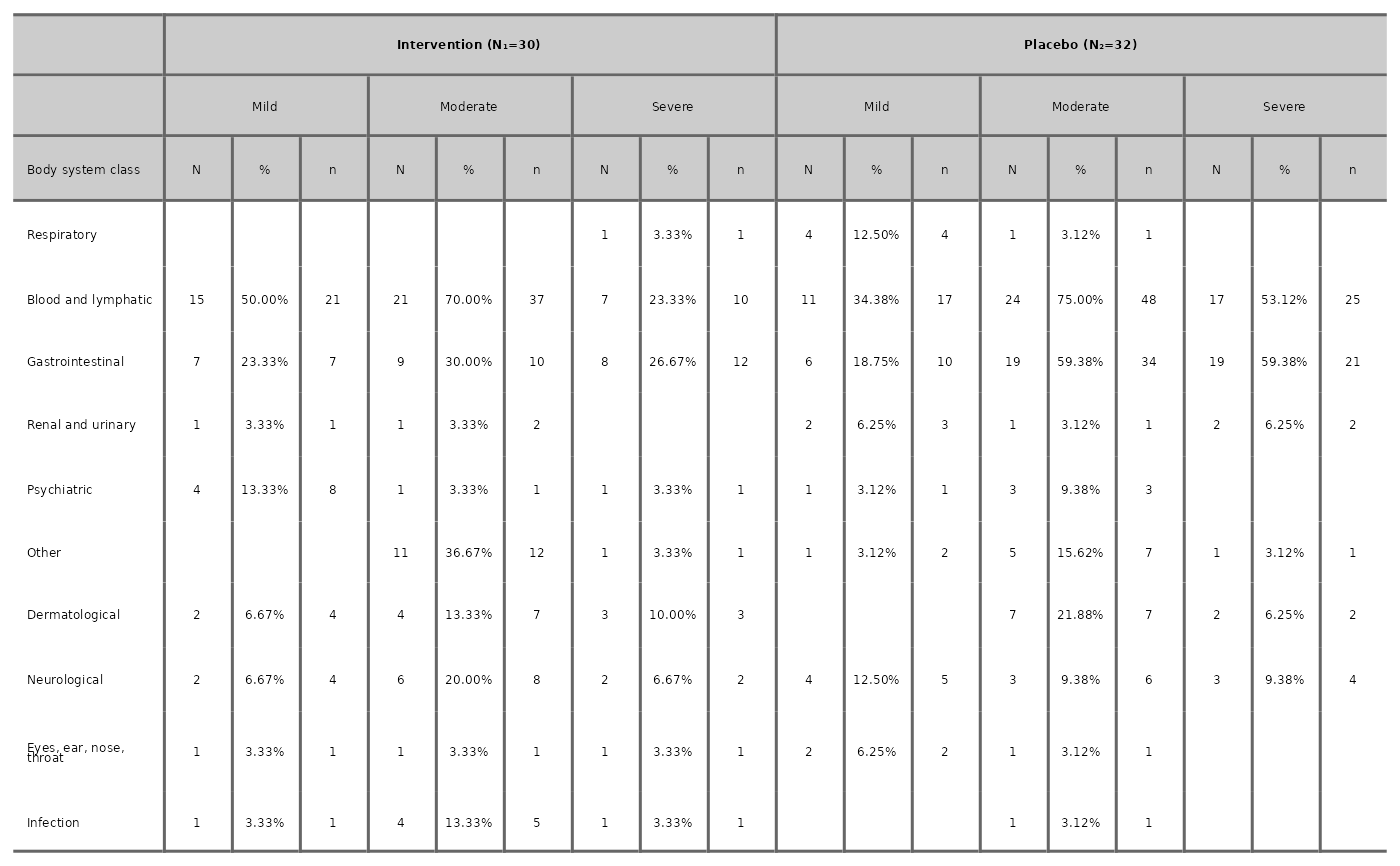
Table of frequencies and proportions of events by severity categories
aeseverity.Rdaeseverity is used to plot a table of AE summary by severity level and body system class for each arm using the following summary statistics:
N: Frequency (number of participants with at least one event for each severity level and body system class)
%: Proportions (number of participants with at least one event for each severity level and body system class relative to number of participants at risk)
n: Number of adverse events for each severity level and body system class
Note that aeseverity can only take up to 5 severity levels for the severity variable.
Usage
aeseverity(
  data,
  arm_levels,
  severity_levels = NULL,
  body_system_class = "body_system_class",
  severity = "severity",
  id = "id",
  arm = "arm",
  n_events = TRUE,
  arm_names = NULL,
  severity_names = NULL,
  proportions_dp = 1,
  save_image_path = NULL,
  save_docx_path = NULL
)
Arguments
- data
data frame with adverse_event, body_system_class, severity, id and arm columns
- arm_levels
vector of factor levels in arm variable
- severity_levels
vector of severity levels in ascending order if severity is not ordered factor
- body_system_class
name of body_system_class column
- severity
name of severity column
- id
name of id column
- arm
name of arm column
- n_events
a logical value whether to include number of events for each body system class and severity
- arm_names
vector of names for each arm in arm variable
- severity_names
vector of names for each severity in severity variable
- proportions_dp
number of decimal places for proportions
- save_image_path
file path to save table as image
- save_docx_path
file path to save table as docx