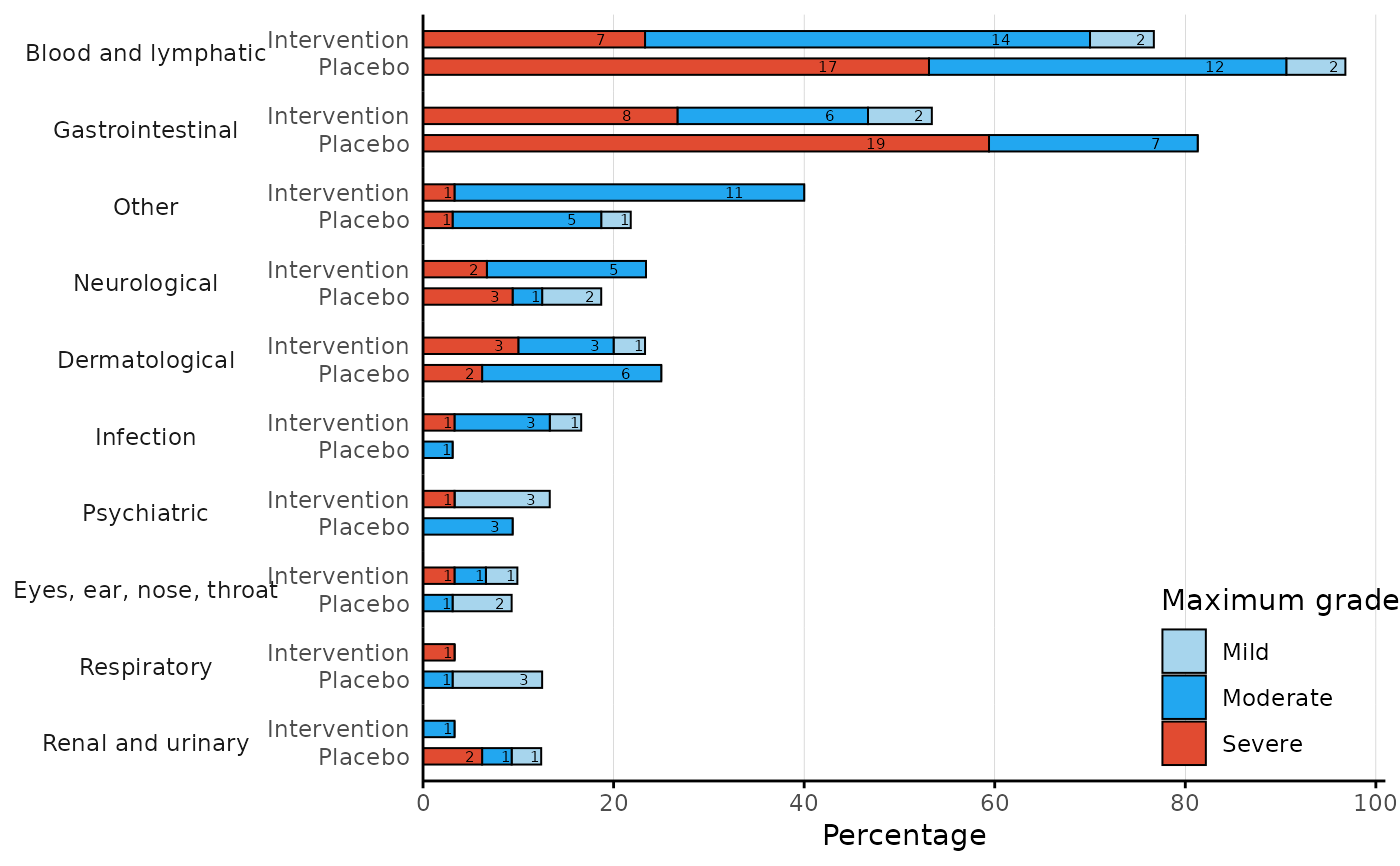
Stacked bar chart of proportions for each body system class by arm and maximum severity
aestacked.RdStacked bar chart of proportions for each body system class by arm and maximum severity
Usage
aestacked(
  data,
  arm_levels,
  body_system_class = "body_system_class",
  severity = "severity",
  id = "id",
  arm = "arm",
  arm_names = NULL,
  severity_levels = NULL,
  severity_colours = NULL,
  save_image_path = NULL
)
Arguments
- data
data frame with adverse_event, body_system_class, severity, id and arm columns
- arm_levels
vector of factor levels in arm variable
- body_system_class
name of body_system_class column
- severity
name of severity column
- id
name of id column
- arm
name of arm column
- arm_names
vector of names for each arm in arm variable
- severity_levels
vector of level of severity in ascending order if severity is not ordered factor
- severity_colours
vector of colours for level of severity in ascending order
- save_image_path
file path to save stacked bar chart plot as image