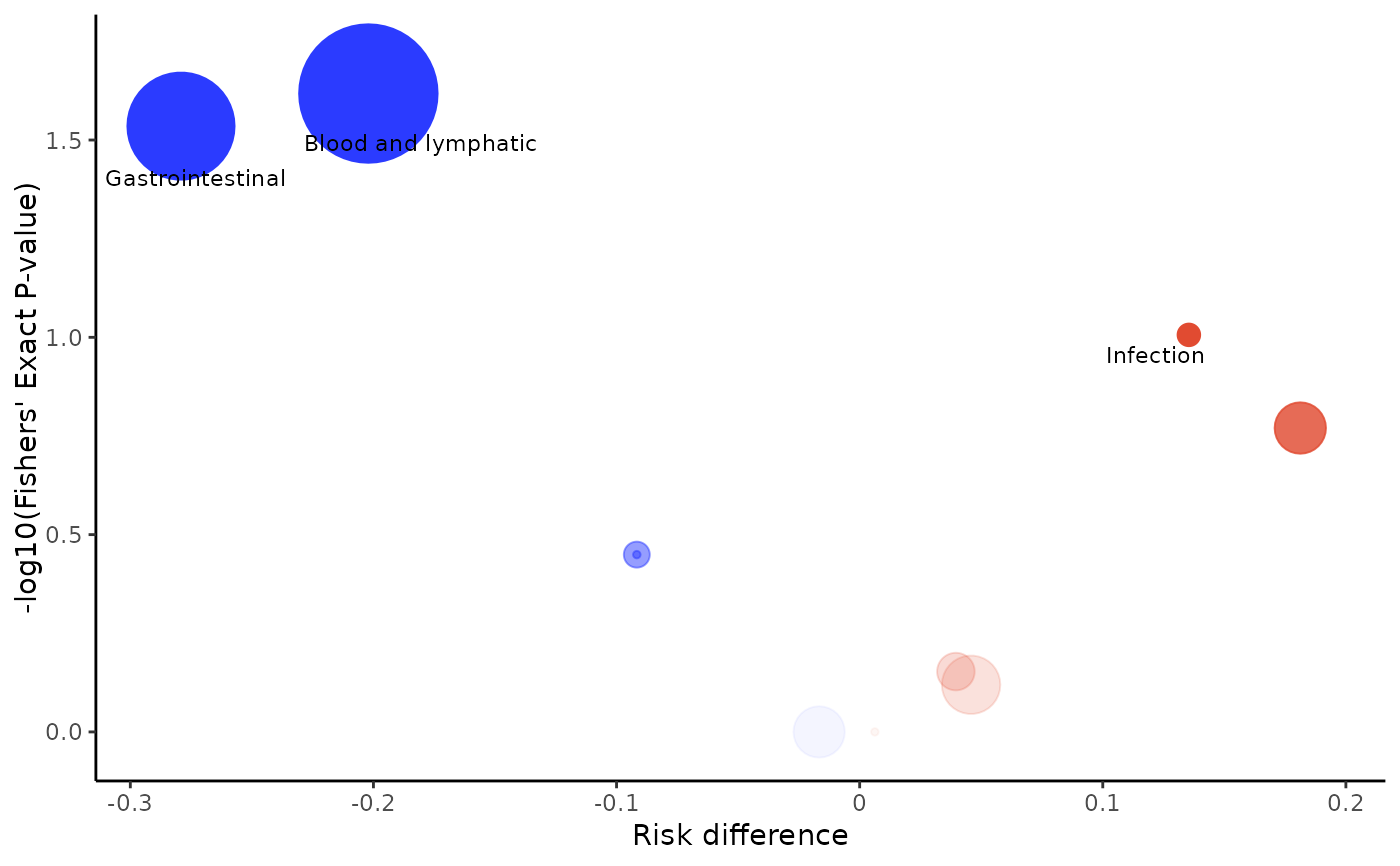
Volcano plot of AEs between two treatment arms to help identify potential signals of harm
aevolcano.Rdaevolcano creates a volcano plot of treatment effect estimate with the following characteristics:
x-axis represents the treatment effect estimate (risk difference/ relative risk / odds ratio/ incidence rate ratio)
y-axis represents the p-value estimated via two-tailed Fisher's exact test or model fitted on the -log10 scale
centre of the bubble indicates the coordinates for each adverse event
size of bubble is proportional to the total number of events for both treatment arms combined
colour saturation corresponds to the -log10(p-value), indicating the strength of the treatment effect with red indicating greater risk in the intervention arm and blue indicating greater risk in the control arm
labels are added to events where p-value is less than 0.1
Arguments
- data
data frame with adverse_event, body_system_class, id and arm columns (optional: date_rand, last_visit and variables to be included in model)
- control
factor level of control arm
- intervention
factor level of intervention arm
- body_system_class
name of body_system_class column
- id
name of id column
- arm
name of arm column
- date_rand
name of date_rand column
- last_visit
name of last_visit column
- model
unadjusted risk difference/relative risk or model used for computation of treatment effect estimate and p-value
- variables
vector of variable names to be included in the model for computation of treatment effect estimate (excluding arm)
- bubble_colours
vector of colours for bubbles indicating greater risk in the intervention arm or control arm
- p_value_cutoff
labels are added to events having p-values lower than p_value_cutoff
- save_image_path
file path to save volcano plot as image
Treatment Effect Estimate
The treatment effect and its p-value are estimated via the following models below:
unadjusted (RD): unadjusted risk difference with p-value obtained via two-tailed Fisher's exact test
unadjusted (RR): unadjusted relative risk with p-value obtained via two-tailed Fisher's exact test
unadjusted (OR): unadjusted odds ratio with p-value obtained via two-tailed Fisher's exact test
unadjusted (IRR): unadjusted incidence rate ratio with p-value obtained via two-tailed Fisher's exact test
Poisson (rate): fitting a generalised linear model with Poisson family and log link with length of follow up time as offset
Poisson (count): fitting a generalised linear model with Poisson family and log link with count as response
Negative Binomial (rate): fitting a Negative Binomial model with length of follow up time as offset
Negative Binomial (count): fitting a Negative Binomial model with count as response
Binomial (logit): fitting a generalised linear model with Binomial family and logit link
Binomial (log): fitting a generalised linear model with Binomial family and log link
Binomial (identity): fitting a generalised linear model with Binomial family and identity link
The default model is the unadjusted (RD) model.
For Poisson and Negative Binomial models, the treatment effect estimate is the Incidence Rate Ratio (IRR). For Binomial (logit) model, the treatment effect estimate is the Odds Ratio (OR). For Binomial (log) model, the treatment effect estimate is the Relative Risk (RR). For Binomial (identity) model, the treatment effect estimate is the Risk Difference (RD).
The reference group for the treatment arm in the regression model is the control arm.
Additional covariates besides arm can be added into the model via the argument variables.
Note that interaction terms cannot be added to the model.
Examples
df2$aebodsys <- as.factor(df2$aebodsys)
aevolcano(df2, body_system_class="aebodsys", control="Placebo", intervention="Intervention")