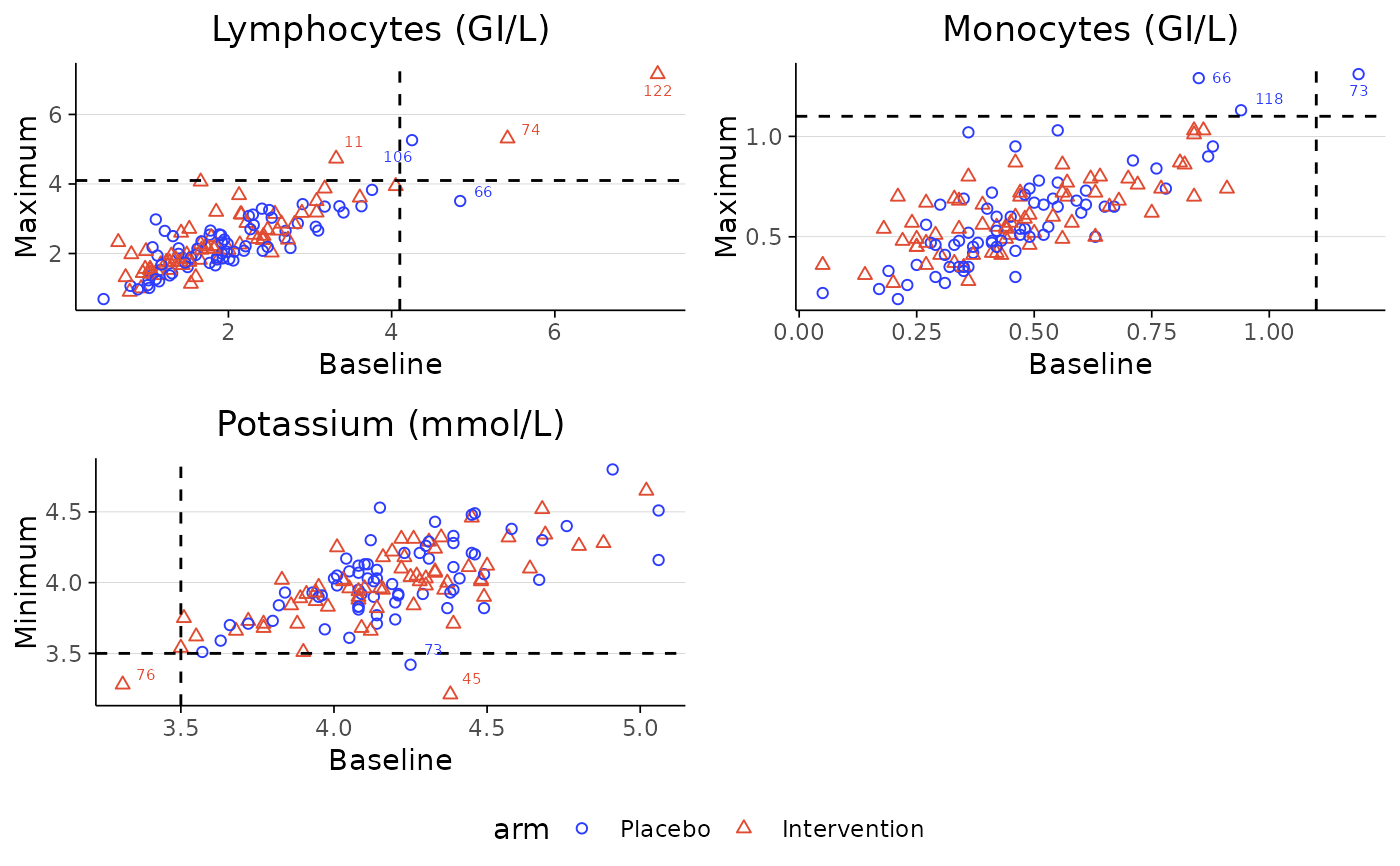
Scatterplot matrix for baseline vs follow-up laboratory values by treatment group
labscatter.Rdlabscatter generates a scatterplot matrix to visualise multiple continuous harm outcomes by treatment group.
For each specified laboratory test, the function plots individual participants' baseline values against their maximum or minimum post-baseline values, or optionally their final visit value.
Dashed lines represent the boundary between normal and abnormal thresholds, which can be defined using the cutoff_list argument or drawn from the the lower and upper columns in the dataset.
Outliers beyond these thresholds are labelled with participant IDs.
Usage
labscatter(
  data,
  arm_levels,
  lab_test_list,
  limit_list,
  cutoff_list,
  lab_test = "lab_test",
  visit = "visit",
  id = "id",
  arm = "arm",
  base = "base",
  aval = "aval",
  lower,
  upper,
  last_visit = FALSE,
  arm_names = NULL,
  arm_colours = NULL,
  save_image_path = NULL
)
Arguments
- data
dataframe with lab_test, visit, id, arm, base and aval columns (optional: lower and upper limit columns)
- arm_levels
vector of factor levels in arm variable
- lab_test_list
a character vector of laboratory test names to be included in the scatterplot matrix
- limit_list
a character vector specifying the direction of the cutoff for each laboratory test in
lab_test_list; each element should be either"upper"or"lower"- cutoff_list
a numeric vector of cutoff values (upper or lower) for each laboratory test in
lab_test_list- lab_test
name of lab_test column
- visit
name of visit column
- id
name of id column
- arm
name of arm column
- base
name of base column
- aval
name of aval column
- lower
name of lower column
- upper
name of upper column
- last_visit
a logical value whether to plot against final visit laboratory measurement value instead of maximum/minimum across all follow-up visits
- arm_names
a character vector of names for each arm in arm variable
- arm_colours
a vector of colours for each arm
- save_image_path
file path to save scatterplot matrix as image